UX Planet
7/20/2026
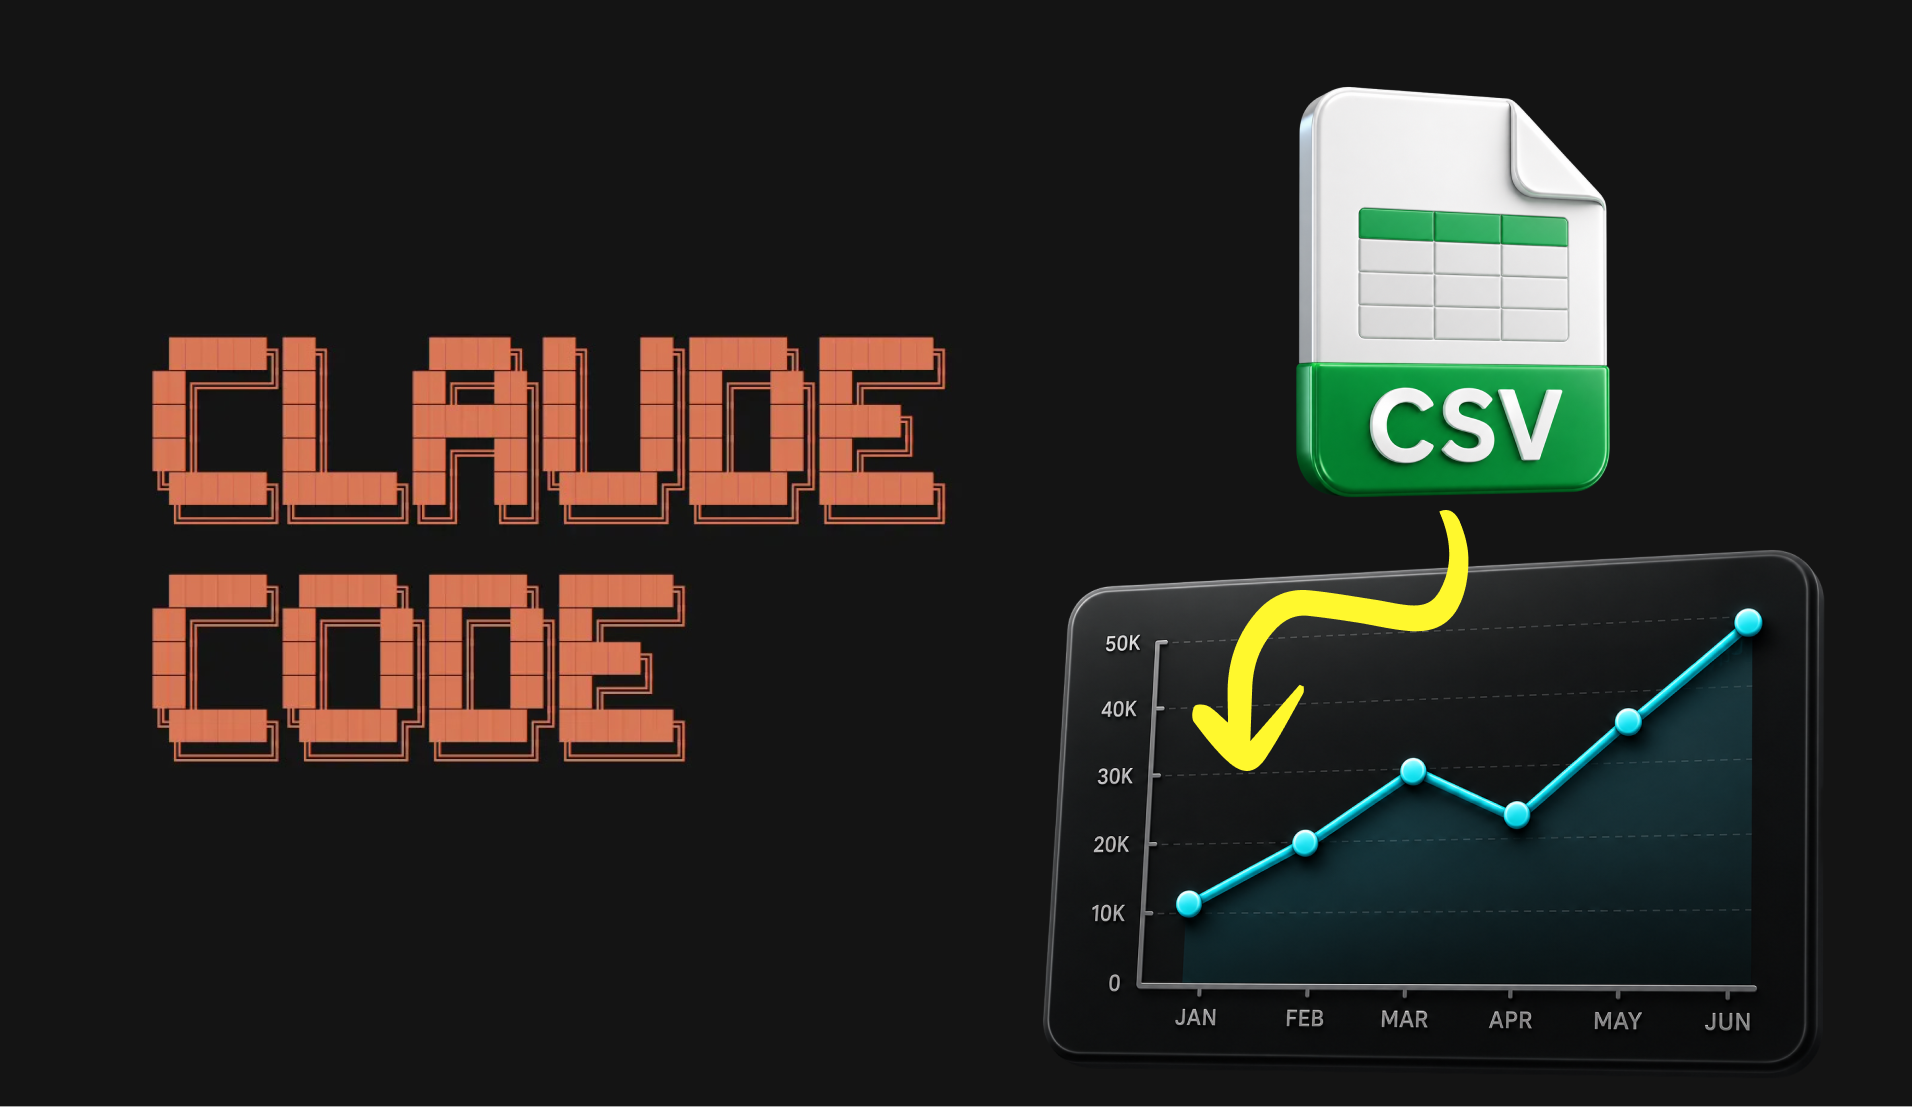
How to Turn a CSV into Interactive Charts with Claude Code
Short summary
A tutorial on using Claude Code to transform CSV files into interactive charts for easier data exploration. The article targets users who want to leverage AI tooling for quick data visualization without manual chart-building. Only a teaser snippet is available from the RSS feed, so depth and specifics cannot be fully assessed.
- •Tutorial covers converting CSV files to interactive charts using Claude Code
- •Targets users needing quick data exploration without manual chart setup
- •Full content is behind a Medium paywall; only teaser available
Generated with AI, which can make mistakes.
Is this a good recommendation for you?